Skip to content
GCIBook a demo
GCI
Line drawing of a mountain range in white on a blue background

Uncover the margin potential your reporting does not reveal.

Sales Performance

GCI Performance Insights | Sales Performance

Uncover untapped revenue and margin, spot the customers who are quietly pulling back, and focus your sales team on the actions with the biggest financial impact.

From initial assessment to implementation – all in one tool, at a fixed price.

Assess. Prioritize. Operationalize. Realize.

One data export · one week · clear performance levers · quantified priorities

Your reporting shows the result. Not what's behind it.

You know your revenue and contribution margin. What's less obvious is where margin is lost and which opportunities go unused. The causes: varying prices, product mix, the profitability of individual customers, and customer relationships that change gradually.

01 · Customer profitability

Not every euro of revenue is worth the same.

Discounts, freight, order handling, and the cost of serving each account all shape what a customer contributes to profit. Then there's product mix: stable revenue doesn't automatically mean stable margin.

02 · Pricing

Three systems, three prices.

List price, quoted price, and realized price tell different stories. Without a common baseline, every price difference looks like a one-off. Only a systematic comparison across customers, products, and sales territories reveals the patterns.

03 · Customer potential

Plenty of opportunities. But which ones really pay off?

Many companies suspect there's more to sell to existing customers. The hard part is putting a number on it and turning it into sales priorities.

04 · Customer churn

Revenue grows. Customers still slip away.

Price increases and growth at a few large accounts can mask the fact that other customers order less often, buy less, or stop ordering altogether.

What matters is which opportunities and risks carry real financial weight, and where to start.

Your sales performance from six angles.

See where revenue and margin are lost, which opportunities sit in your existing business, and where it's worth digging deeper.

01 · Demand & Leads

How are leads, quotes, and closed deals trending?

A look at the sales funnel shows where business is lost and how much the open pipeline can still contribute to planned revenue.

02 · Customer Potential

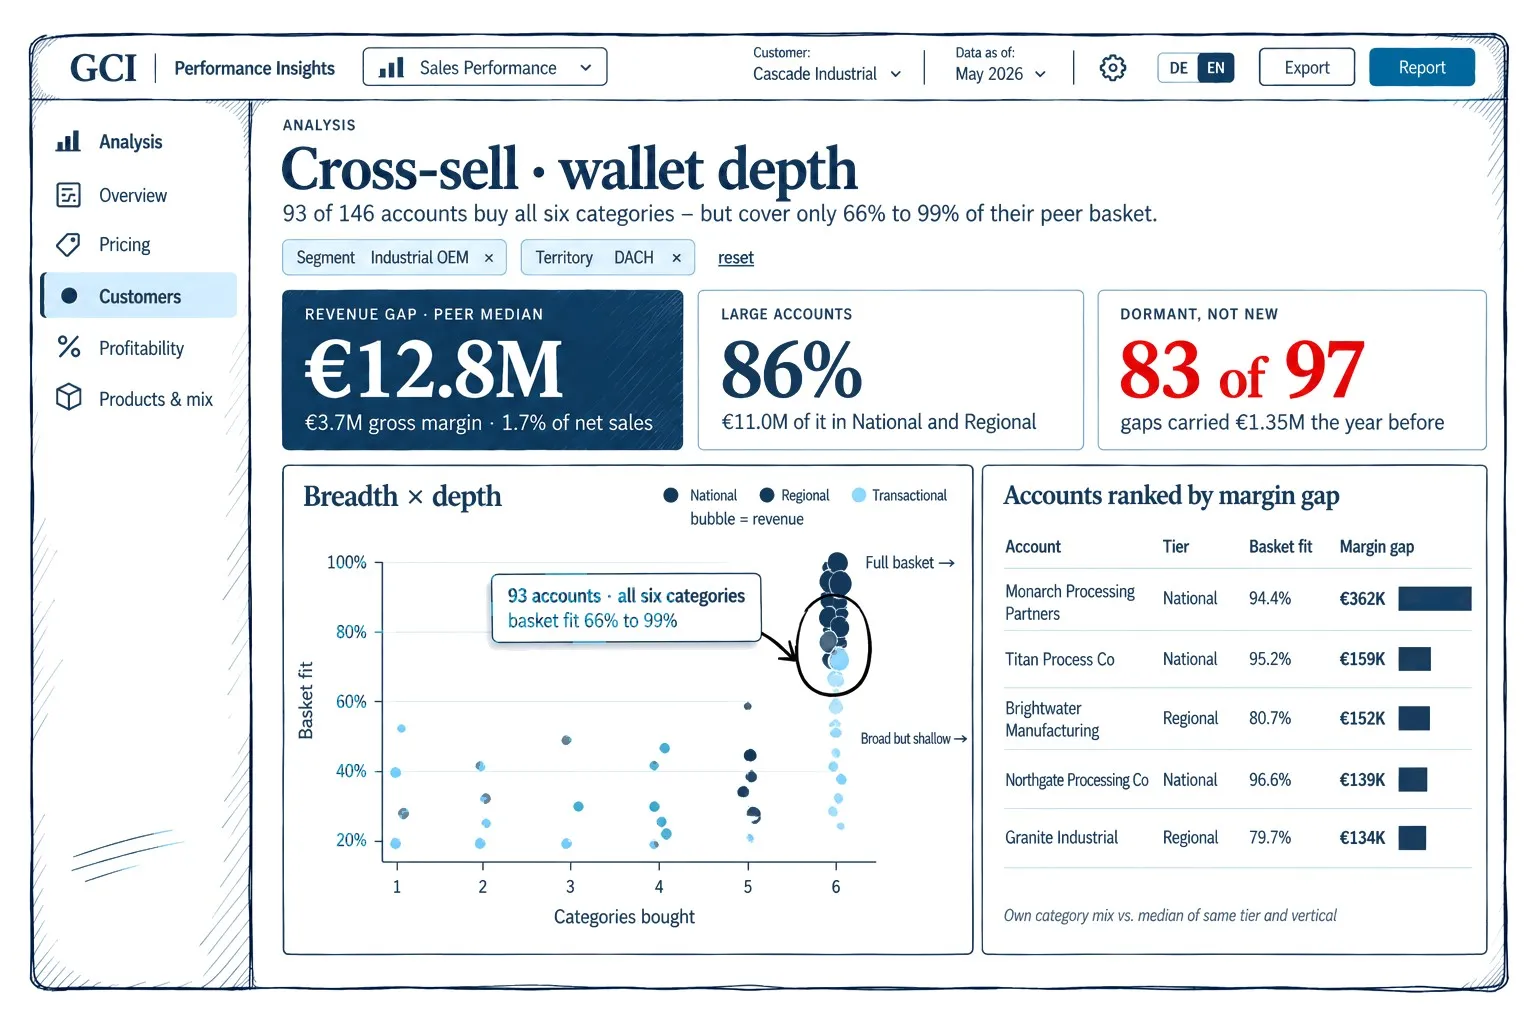
What do your customers buy, and what do comparable customers buy?

We look at missing product categories and differences in basket depth. That includes volumes customers have committed to but not yet ordered.

03 · Channels & Customers

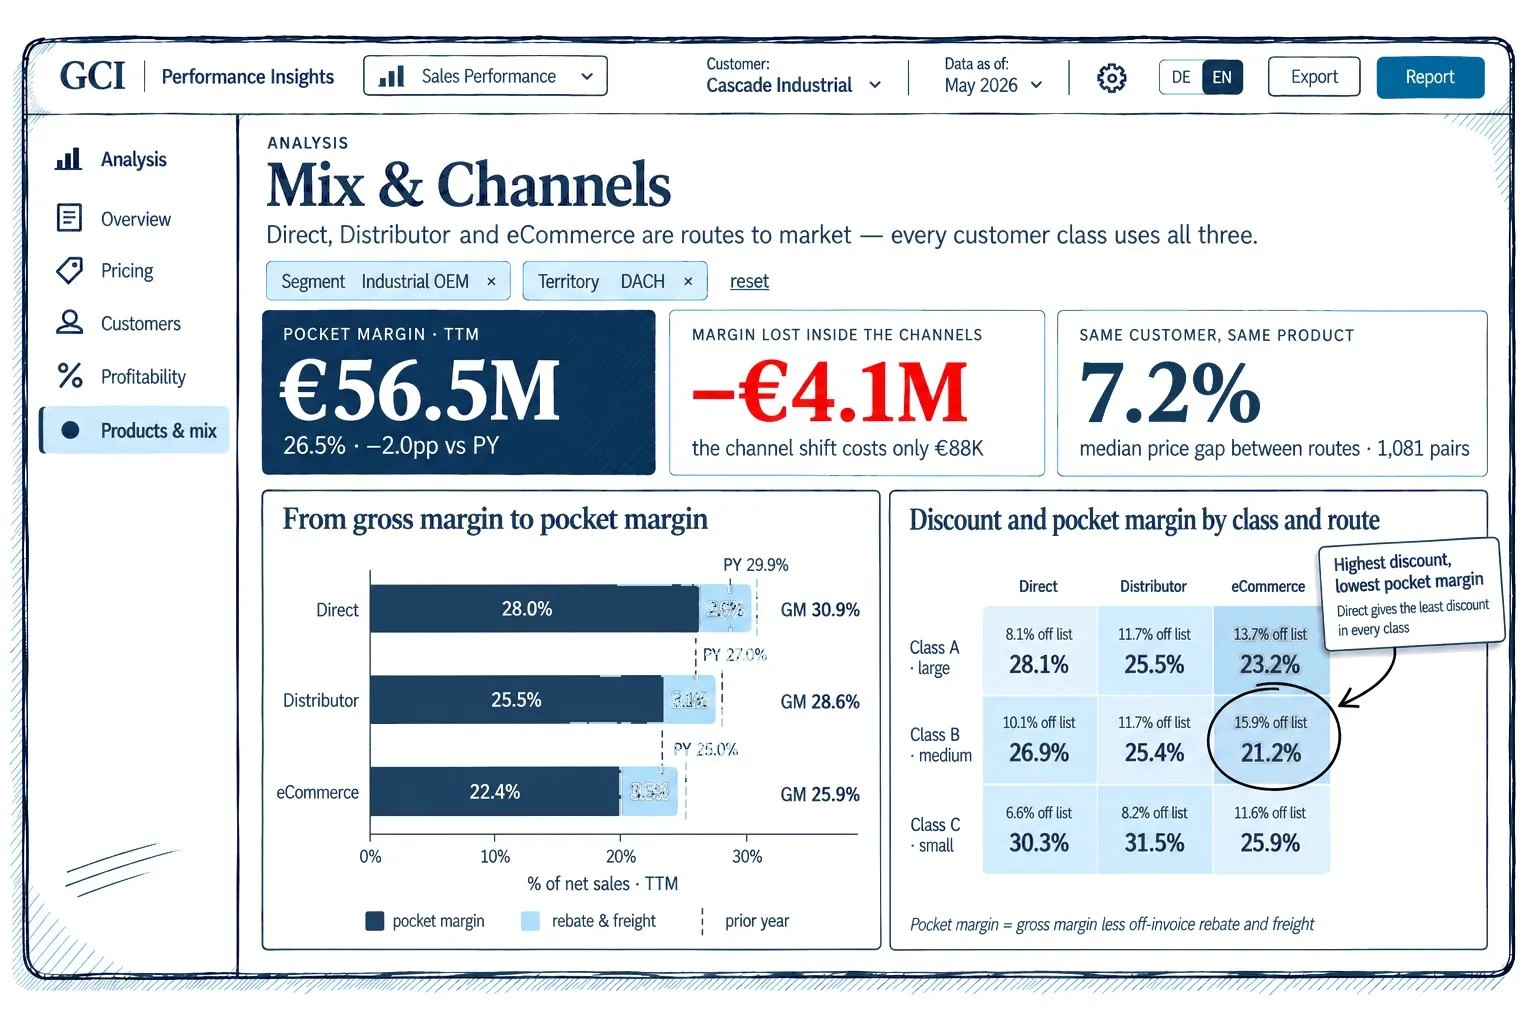
Which customers and channels contribute to profit?

Beyond revenue, we look at profitability after cost to serve, such as freight, order handling, and account servicing, and at how much your business depends on individual customers.

04 · Sales Execution

How do win rates and results differ across your sales teams?

We put performance in the context of each team's customer portfolio and show how revenue and margin are tracking against plan.

05 · Pricing & Deal

How much of your target price do you actually realize?

We examine discounts, price differences for the same product, and price gaps compared with similar customers.

06 · Customer Development

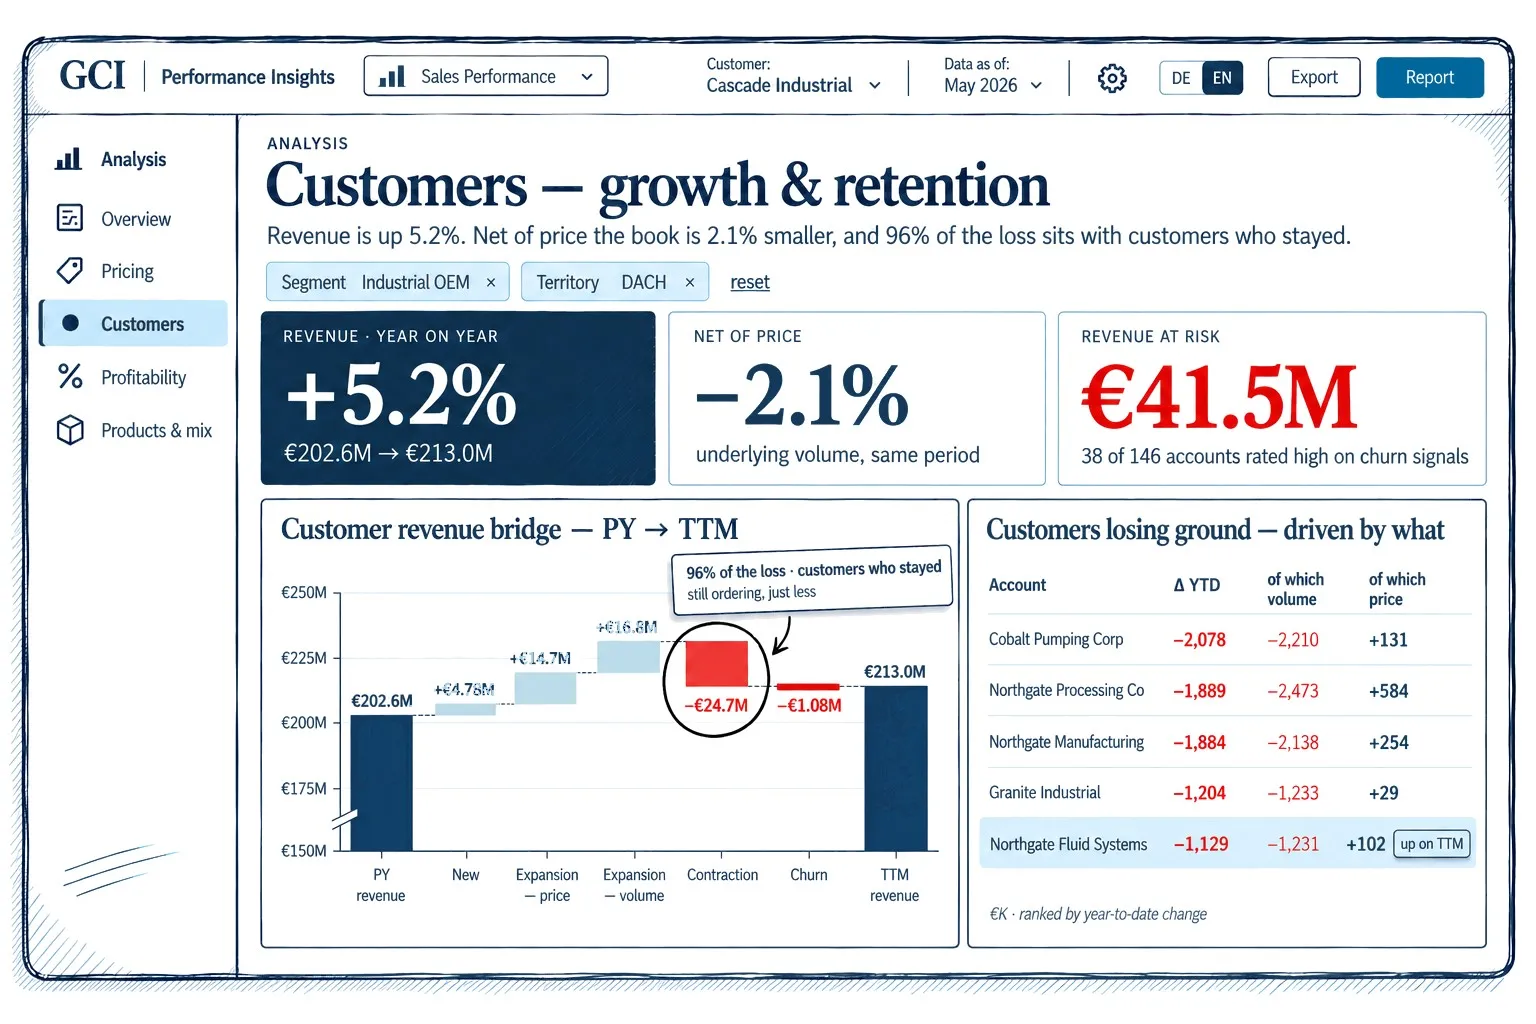
Is your business really growing, or is it mainly higher prices?

We separate price and volume effects and show which customers are growing, ordering less, or have already gone inactive.

All six areas in one scorecard.

It brings the results together and shows where a closer look pays off. The analyses behind it go into detail, down to the customer, product, and order-line level.

Book a demo

30 minutes with an anonymized data set

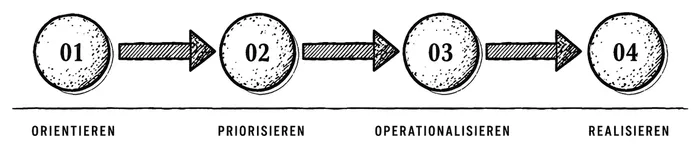
Four steps from analysis to execution

GCI Performance Insights shows where to start, which opportunities your sales organization holds, and how to capture them.

  1. Health Monitor

    01 · Assess

    Health Monitor

    Where should we look more closely?

    Your sales performance in six areas, at a glance. See where you're strong and where to focus.

  2. Opportunities & Key Findings

    02 · Prioritize

    Opportunities & Key Findings

    What opportunities do we have?

    Every lever, ranked by value. See where additional revenue and margin are possible and what that means for the bottom line.

  3. Drill-downs & Scenario Planning

    03 · Operationalize

    Drill-downs & Scenario Planning

    Where do we start, and what's achievable?

    Every customer on one page, with potential and risk down to individual products. Scenarios show how much of it can be realized overall.

  4. Opportunity & Activity Planning

    04 · Realize

    Opportunity & Activity Planning

    How does potential turn into planned contributions?

    Insights turn into next steps. Action lists show who does what by when, and what impact to expect.

Assess, Prioritize, Operationalize, Realize

01 · Assess

Where to focus your attention.

Sales analysis starts with an assessment. The Health Monitor looks at your sales organization from six angles and scores each dimension against fixed rules. That shows you where you're strong and where to start.

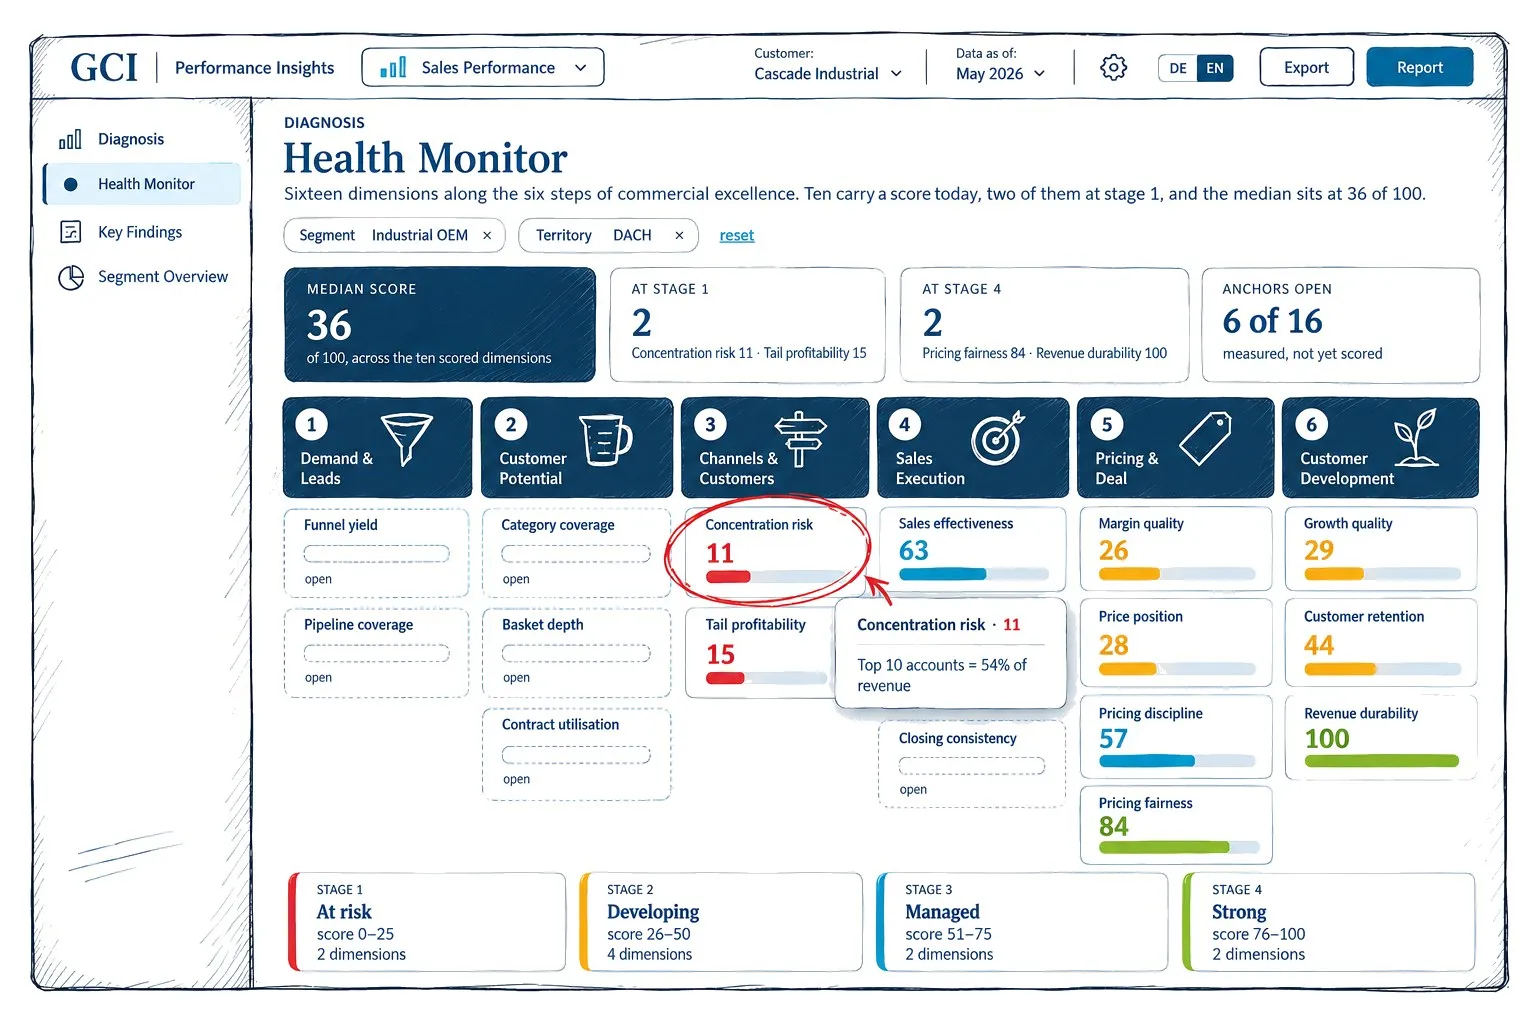
Health Monitor: six areas, a maturity score for each dimension, weakest dimension highlighted

Your sales strengths and weaknesses at a glance

Health Monitor

The Health Monitor scores 16 dimensions across six areas of your sales organization, on a four-stage scale from at risk to strong. Every score traces back to the analysis behind it. Anything that can't be scored yet stays visible as an open dimension.

02 · Prioritize

Where you stand. And where to act.

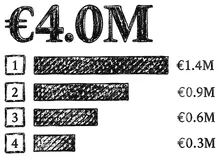
Every finding traces back to the customers, products, and prices behind it, and is sized in euros.

What's left after order handling costs?

See which customers really contribute to profit.

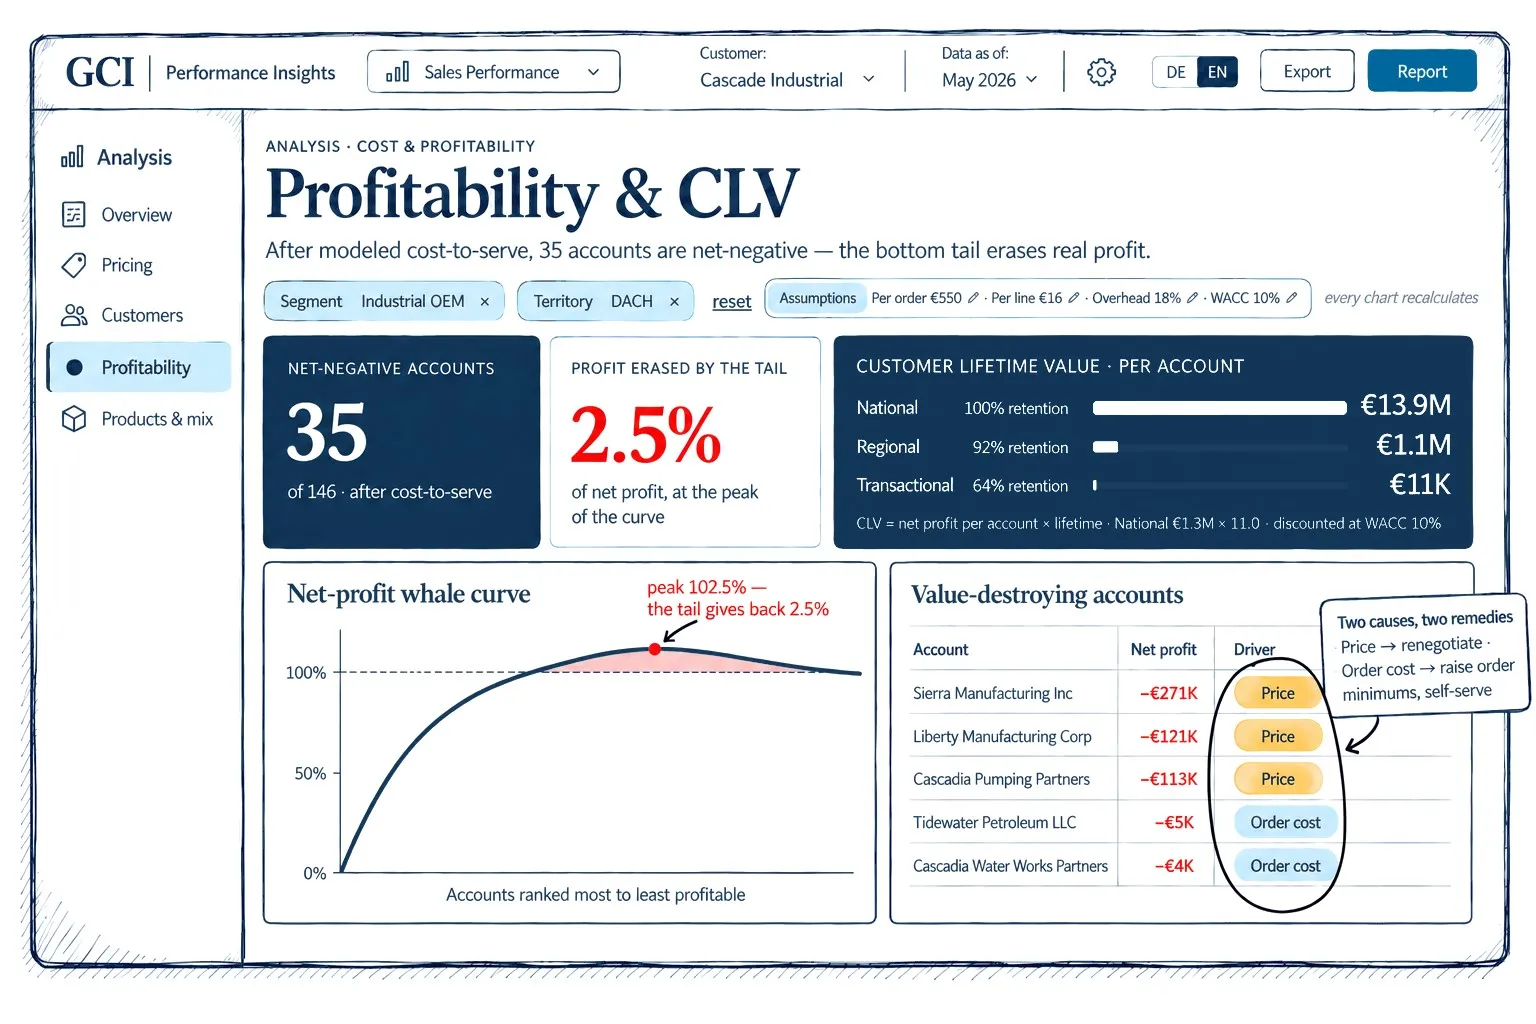
High-revenue customers are not necessarily profitable. Once order processing and overhead costs are factored in (cost to serve), the picture changes. See which customers contribute to profit, where losses arise, and whether low margins or high order-related costs are to blame. In addition, customer lifetime value (CLV) by customer segment shows the long-term value of customer relationships. The model’s assumptions are transparent and can be adjusted.

Book a demo
Customer profitability and customer lifetime value: whale curve after cost to serve, CLV by customer segment, and customers that destroy value

03 · Operationalize

From potential to plan.

The results are reviewed customer by customer. From there, you can build different scenarios for your overall sales plan and check them against existing targets.

Which opportunities hold up for each customer?

Customer dashboard

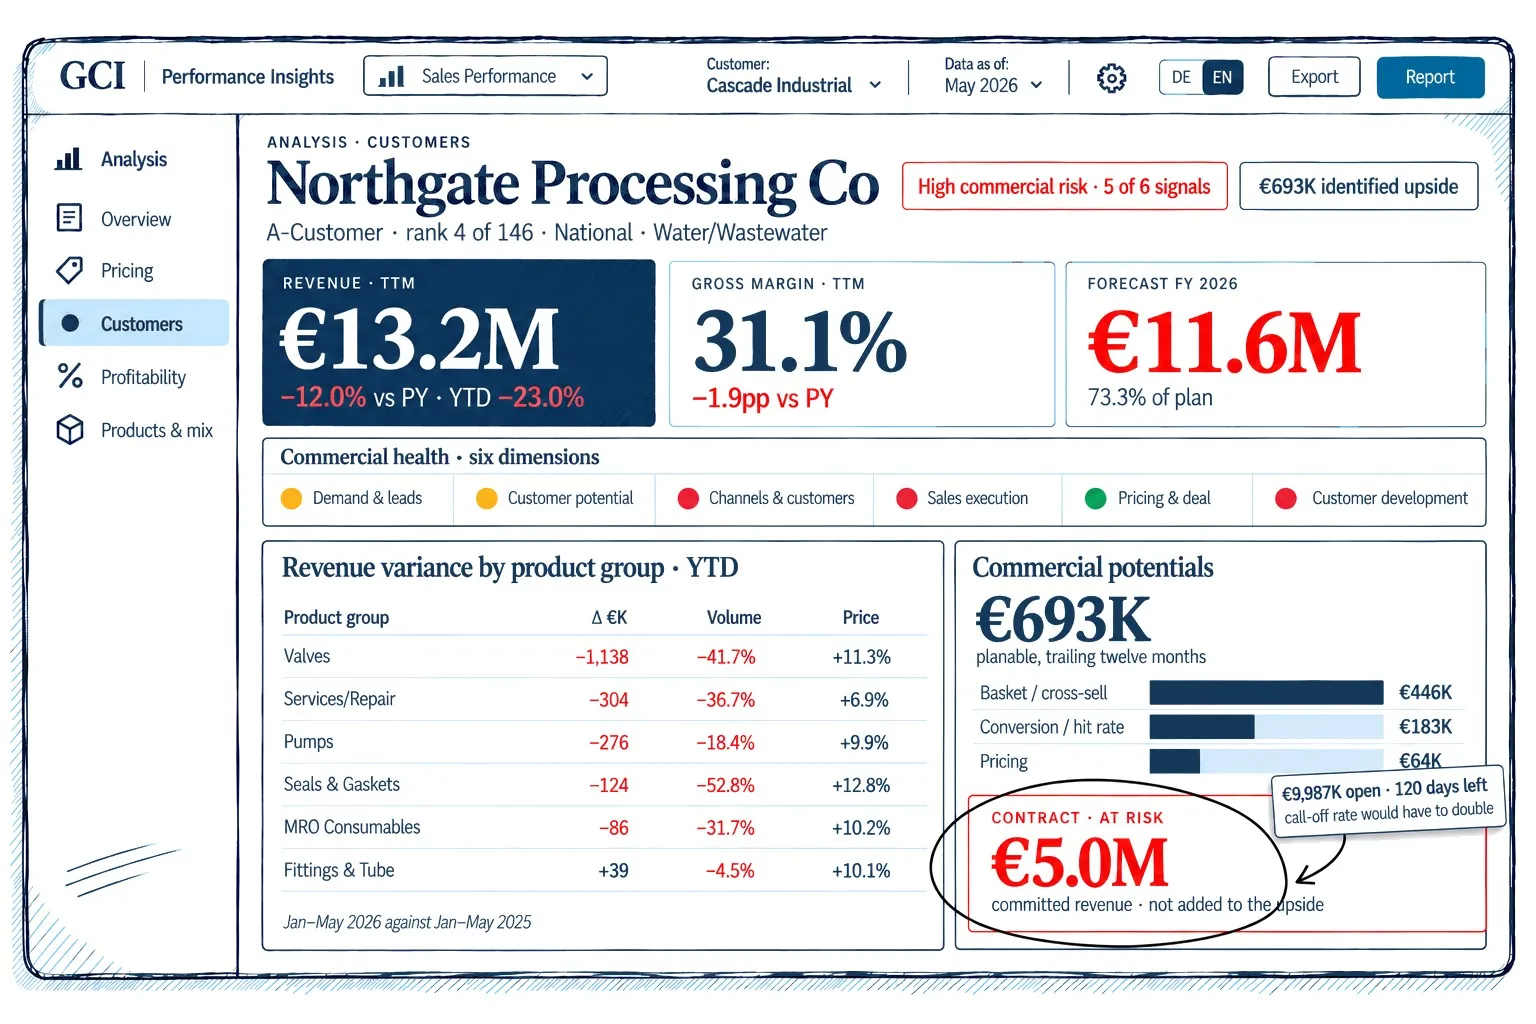
The customer dashboard brings the analysis results together for each customer. Revenue and margin trends, price and volume effects, and a comparison with similar customers help you check identified opportunities and risks and put them in context. This lays the groundwork for customer planning.

Customer dashboard: key figures, the six areas as traffic lights, revenue variance by product group, potential shown separately from contract risk

How much potential can be realized overall?

Scenario planning

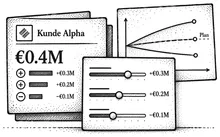
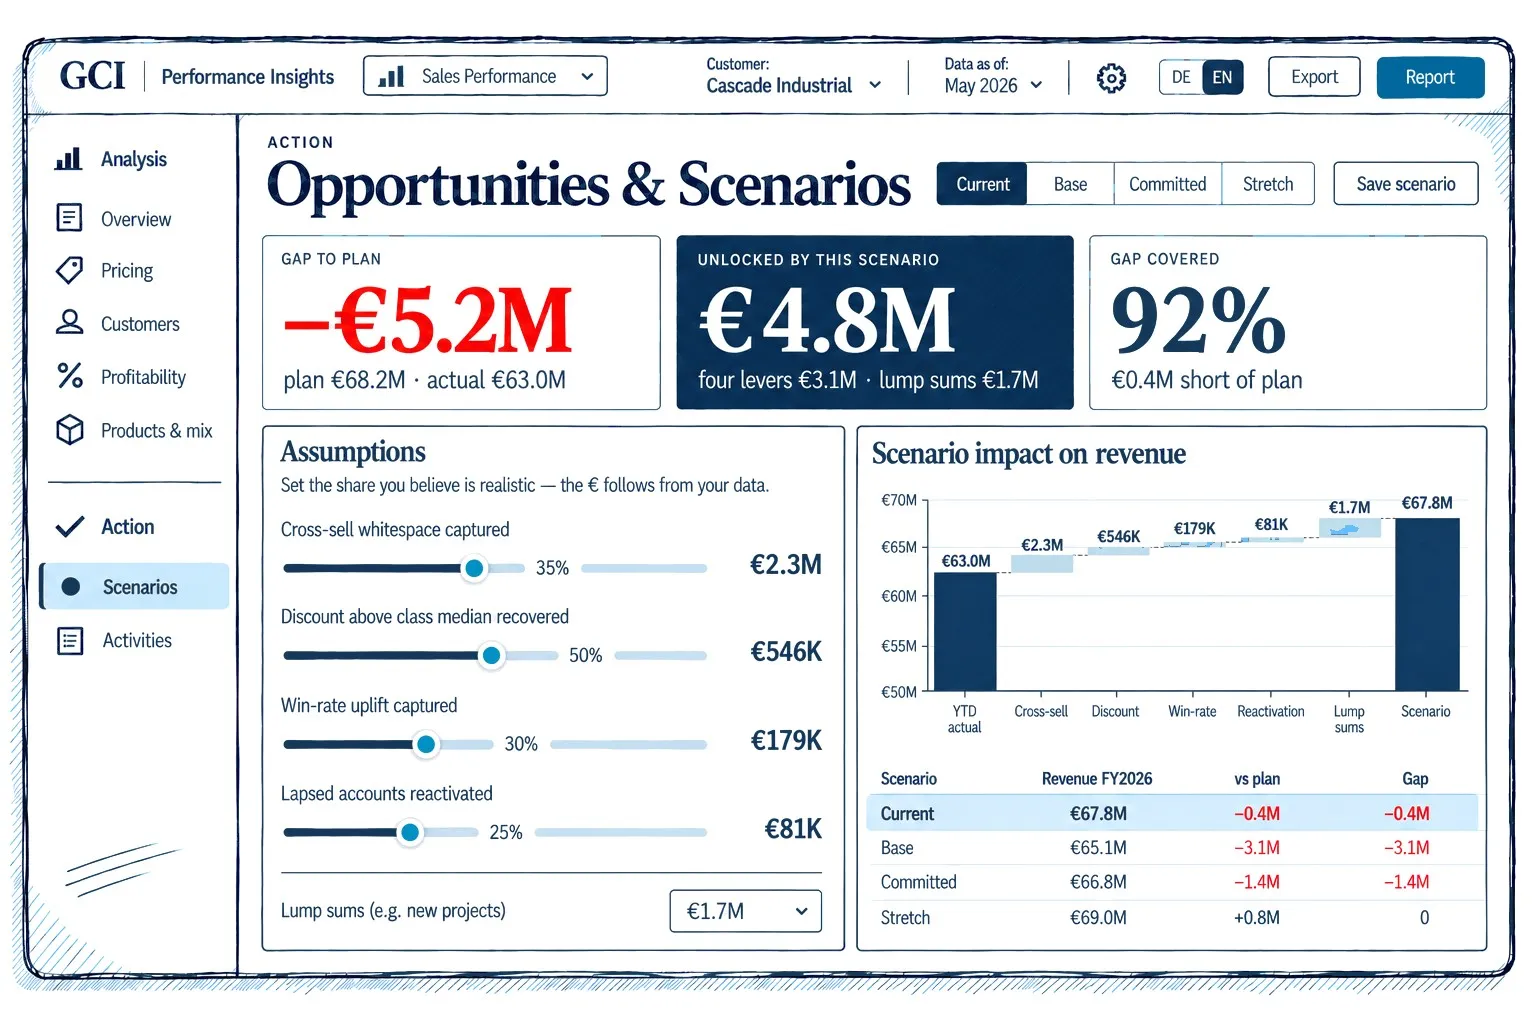
Scenario planning combines the results into an overall sales plan. For each lever, you decide what share you want to realize. Performance Insights calculates the potential contribution to your targets and shows how far the gap to the existing plan can be closed. You can save different scenarios and compare them side by side.

Scenario planning: assumptions by lever, contribution to the plan gap, and scenario comparison

The results translate into actions for individual customers and products. Regular data updates then let you check their impact.

04 · Realize

An opportunity plan with clear ownership.

Scenario planning sets how much potential you aim to realize overall. Opportunity & Activity Planning breaks that target down by customer and adds cross-cutting initiatives. The result is a plan that assigns every targeted contribution to a customer and an owner.

Which customers and which levers will get you to your targets?

Opportunity & Activity Planning

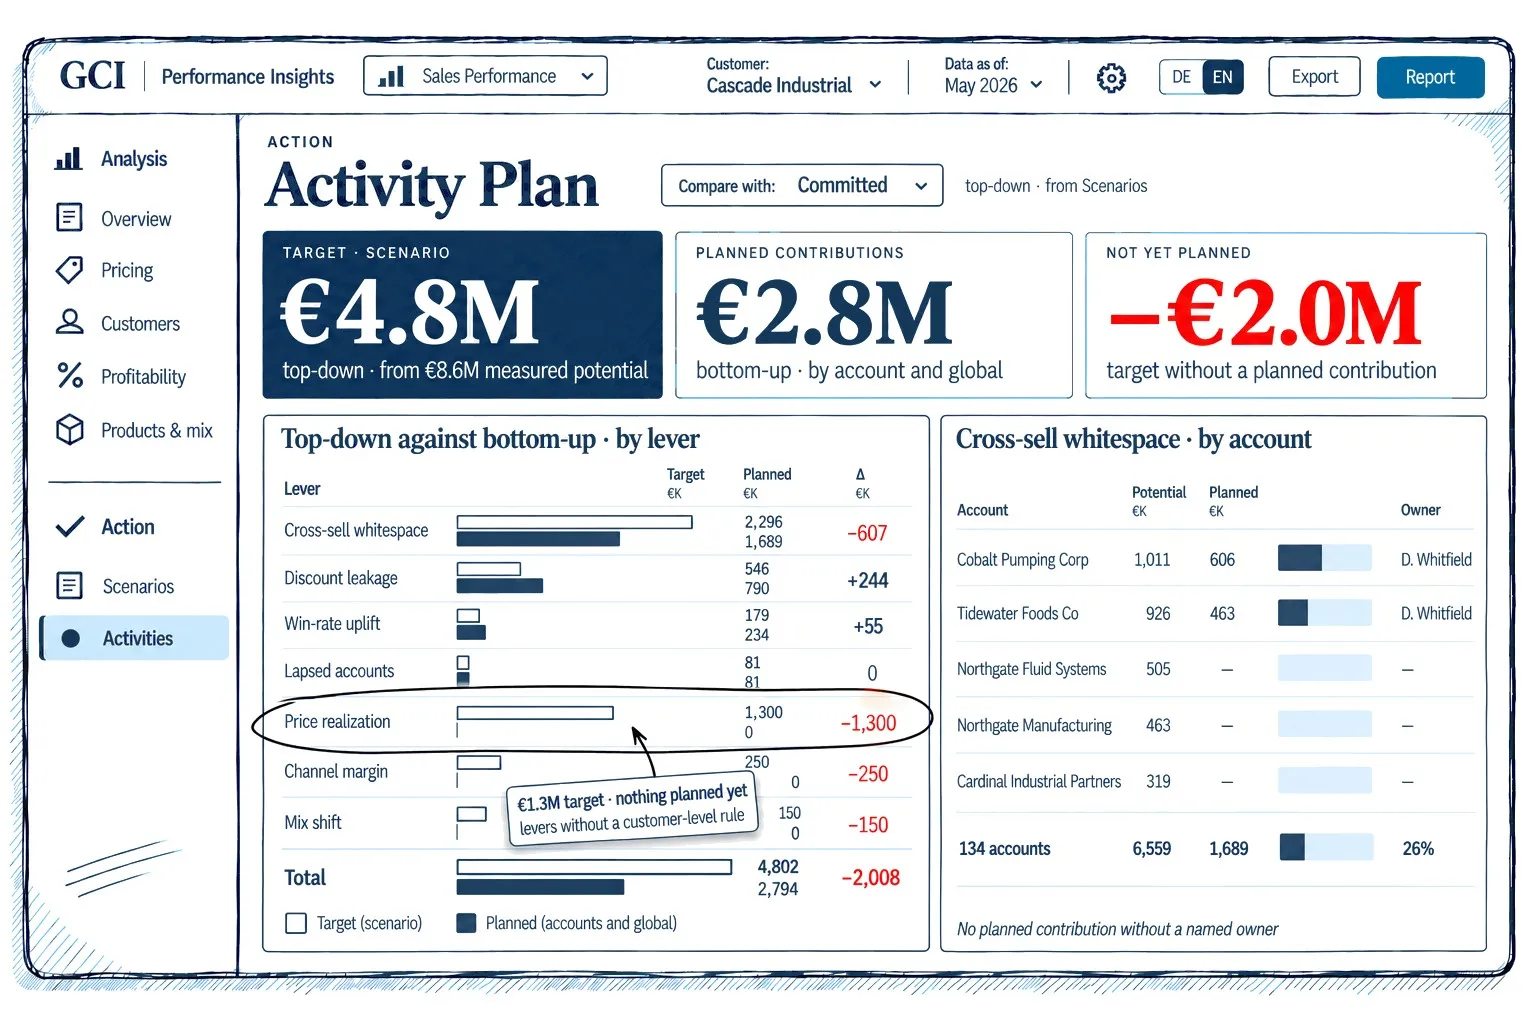
For each customer, decide which opportunities you want to realize, how much, and who owns them. Add cross-cutting initiatives, for example to improve price realization. Opportunity & Activity Planning brings both levels together and compares the planned contributions by lever with the targets from your scenario planning. This shows which targets are already backed by specific plans and where gaps remain.

Opportunity & Activity Planning: scenario target against planned contributions by lever, potential and planned contribution by customer

From identified potential to target to planned contribution, all on one consistent data foundation.

A one-time diagnostic. Or an ongoing management routine.

Choose a one-time diagnostic to inform a decision. Or make GCI Performance Insights a permanent part of how you manage sales, with regularly updated analyses and management routines we establish together.

Two ways to work together

GCI Performance Insights

Diagnostic

One-off analysis at a fixed price · results within one week of receiving the complete, validated data export.

What you get
A comprehensive analysis of your sales performance based on a one-time data export.
How we work together
In a joint results workshop, we review the opportunities identified, discuss the underlying assumptions, and work out possible next steps.
Your outcome
Visibility into opportunities and risks, and a clear decision on what happens next.

GCI Intelligence Services

Managed Intelligence

Regular analyses as part of how you manage sales.

What you get
GCI Performance Insights in ongoing use, with regularly updated data and a management routine built together with you.
How we work together
Together with your team, we set up the data updates, develop the management routines, and help run them. We prepare and facilitate the review meetings and look after the software in day-to-day operation.
Your outcome
An established management routine in which opportunities, planning assumptions, and contributions are reviewed regularly, and the insights can feed into management decisions.

CollaborationIn workshops and review meetings, we work directly in the software with you. Between meetings, we prepare the analyses and update the data.

Data and system connectionYou decide how much data to share. For the one-time diagnostic, a data export is enough, with no access to your internal systems. Customer names can be replaced with unique IDs. For ongoing use, we can work with you to set up a direct data connection to your systems.

We'll work out together which model fits.

Turning analysis into sales decisions.

From annual planning to the customer meeting: GCI Performance Insights gives the executive team, sales leadership, and sales reps the same numbers to base decisions on.

01 · Strategy & planning

Turn growth targets into customer plans.

Strategy offsite · Budgeting · Customer-level planning

Put a value on growth levers, set revenue and contribution margin targets for customers and product groups, and align them with strategic targets.

02 · Sales management

Reset priorities promptly when you're off plan.

Sales meeting · Plan vs. actual review · Forecast review

Analyze variances by territory and team, spot risks to results early, and set priorities for the rest of the planning period.

03 · Performance coaching

Agree on shared priorities in one-on-ones.

One-on-one · Ongoing review

Analyze customer trends together, weigh opportunities and risks against the rep's knowledge of the customer, and agree on next steps.

04 · Key account management

Prepare key customer meetings with the numbers in hand.

Annual review · Account plan · Customer visit

Pull together customer profitability, price trends, growth opportunities, and churn risks for key customer meetings, and use them to refine the account plan.

05 · Price management

Check whether price changes reach the bottom line.

Price adjustment · Terms discussions · Price negotiation

Check price realization, separate price and volume effects, and flag outlier customers and products for the next terms discussions.

06 · Channel management

Manage channels by margin.

Channel strategy · Distributor terms · E-commerce

Where terms and cost data are available, compare direct sales, distributors, and e-commerce by remaining margin, and use the results to refine your channel strategy.

Understanding sales performance.

Expert perspectives on analyzing revenue, margins, and customer potential. We show what drives the numbers and how data turns into sales decisions.

Selected articles

All articles →

Common questions about GCI Performance Insights

Answers on analyses, data, and working together.

We know our revenue and margin figures. What does a sales performance analysis show that our reporting doesn't?

A sales performance analysis lays the groundwork for profitable growth. It shows where profit is lost, where the financial opportunities are, and which trends need early attention. Traditional reporting mainly records how the business has performed. A sales analysis looks at the causes. Specifically, it shows which customers contribute to profit, where margin is lost to discounts and weak price realization, what cross-selling and upselling potential your existing customers offer, and which changes in ordering behavior point to customer churn. It also looks ahead: how much revenue is at stake with customers showing signs of churn, and where revenue and gross profit by customer and product group are likely to land at year end.

GCI Performance Insights connects these perspectives, makes the findings visible down to the customer, product, and order-line level, and quantifies opportunities and risks in euros. That way, your existing sales data shows you which actions to prioritize.

What is GCI Performance Insights, and which analyses does the Sales Performance module include?

GCI Performance Insights is a rule-based performance intelligence platform from GCI Management. It analyzes existing business data to give a clear view of sales performance, identify financial opportunities and risks, and support profitable growth.

The Sales Performance module includes analyses of customer profitability, price realization, price potential, customer potential, customer churn, forecasting, and channel management.

The work follows four steps: Assess with the Health Monitor, Prioritize by financial opportunity and risk, Operationalize at the customer level, and Realize by planning concrete contributions to results. GCI Performance Insights shows systematically where to look more closely. Because every analysis traces back to the individual transaction, your organization gains a better understanding of the economics of its own sales and spots risks and opportunities early. Over time, it builds the ability to make well-founded decisions and improve sales performance on its own.

Can't we just analyze this ourselves with our CRM, Excel, or Power BI?

In principle, yes. The technical tools and the data you need are often already in place. The real effort lies in developing and maintaining the business logic behind the analysis.

GCI Performance Insights has this logic built in, based on years of consulting experience. New insights are available within one week of receiving the complete, validated data export, without spending months building reports and analyses first. Standardized data exports also reveal early on where the underlying data, processes, and systems have weaknesses.

The value goes beyond the software. GCI helps you interpret the results and develop courses of action together. Step by step, your team builds a deeper understanding of how prices and customer relationships drive results. Your existing CRM and BI systems, such as Power BI, stay in place.

What is sales excellence, and how do I measure sales performance?

Sales excellence means systematically developing your sales organization to achieve profitable growth, from winning new customers to capturing revenue and profit potential in your existing customer base. Sales performance is measured with financial and operational KPIs, including revenue growth, contribution margin, price realization, customer profitability, customer development, and lead conversion and win rates.

The Health Monitor in GCI Performance Insights assesses sales performance across 16 dimensions in six areas: Demand & Leads, Customer Potential, Channels & Customers, Sales Execution, Pricing & Deal, and Customer Development. Each dimension is scored by fixed rules on a four-stage scale from at risk to strong. This shows where your sales organization is in good shape, where risks lie, and which growth levers are worth investigating. Dimensions that can't be scored for lack of data remain explicitly visible.

How do I identify unprofitable customers?

Unprofitable customers become visible once you determine what each customer actually costs to serve. Revenue and gross profit alone don't show this. Even multi-level contribution margin accounting, common in many companies, isn't always enough when costs are reported mainly by region, branch, or cost center.

GCI Performance Insights analyzes customer profitability with a cost-to-serve approach. Besides directly attributable costs, it factors in cost drivers such as the number of orders, order lines, and freight. The analysis starts with standardized cost rates, which can be calibrated to your own cost base.

This shows whether low margins or small order sizes are hurting profitability. The results point to specific ways to improve pricing, ordering patterns, and how you serve customers. GCI Performance Insights also calculates customer lifetime value (CLV) by customer segment.

How do I spot margin lost to discounts and weak price realization?

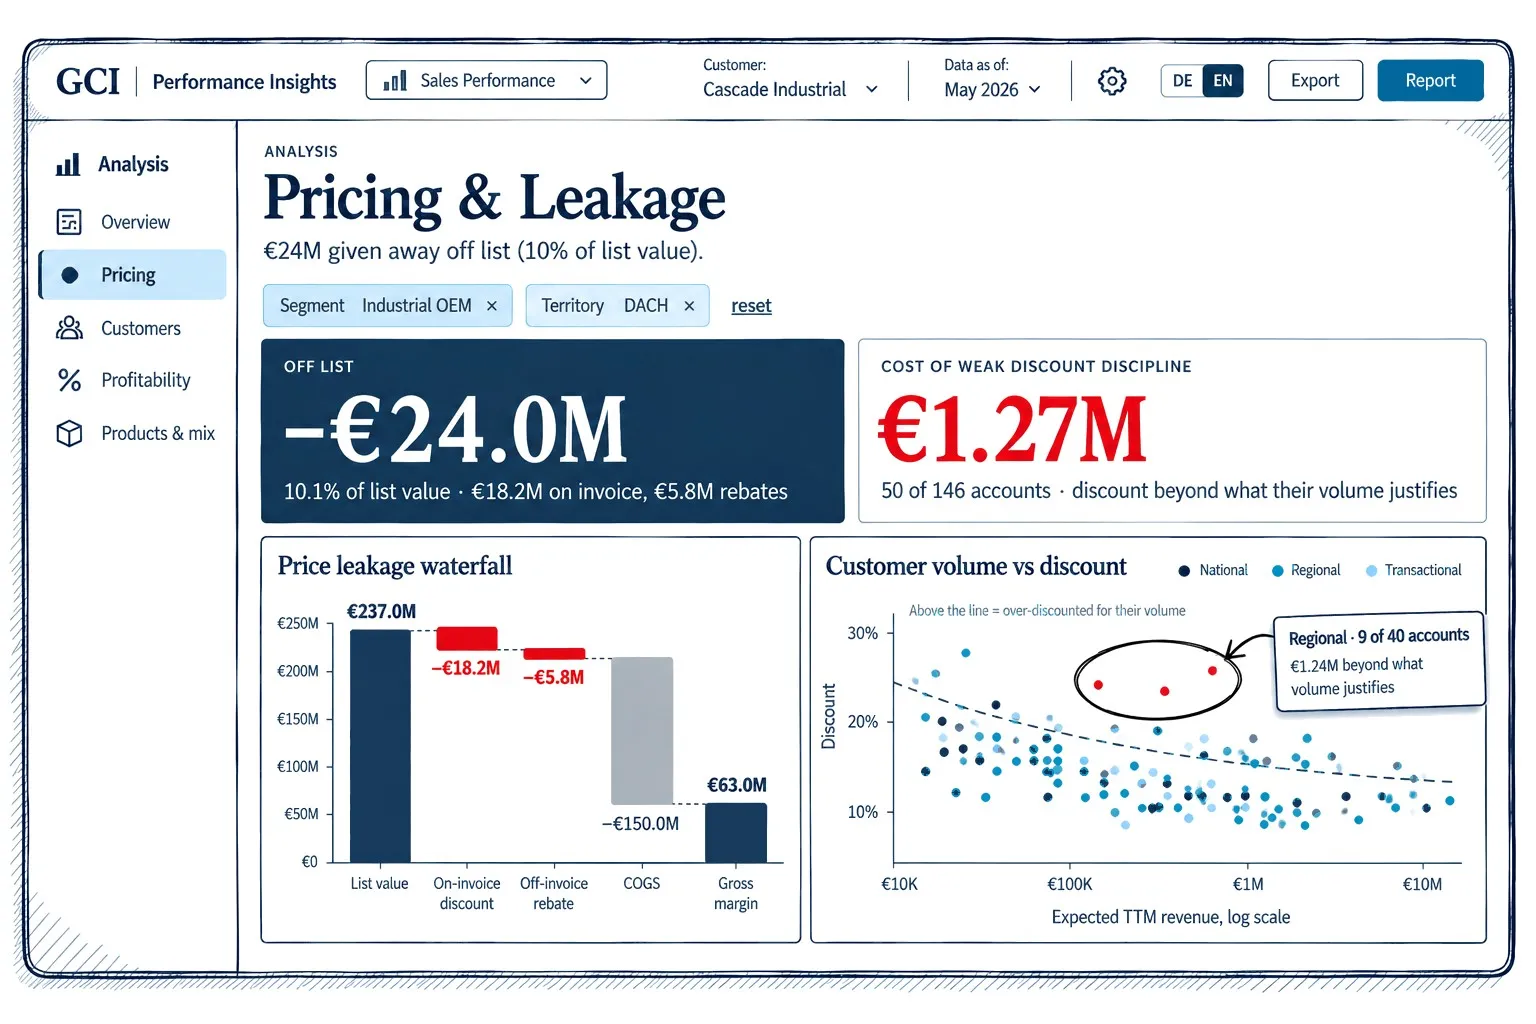
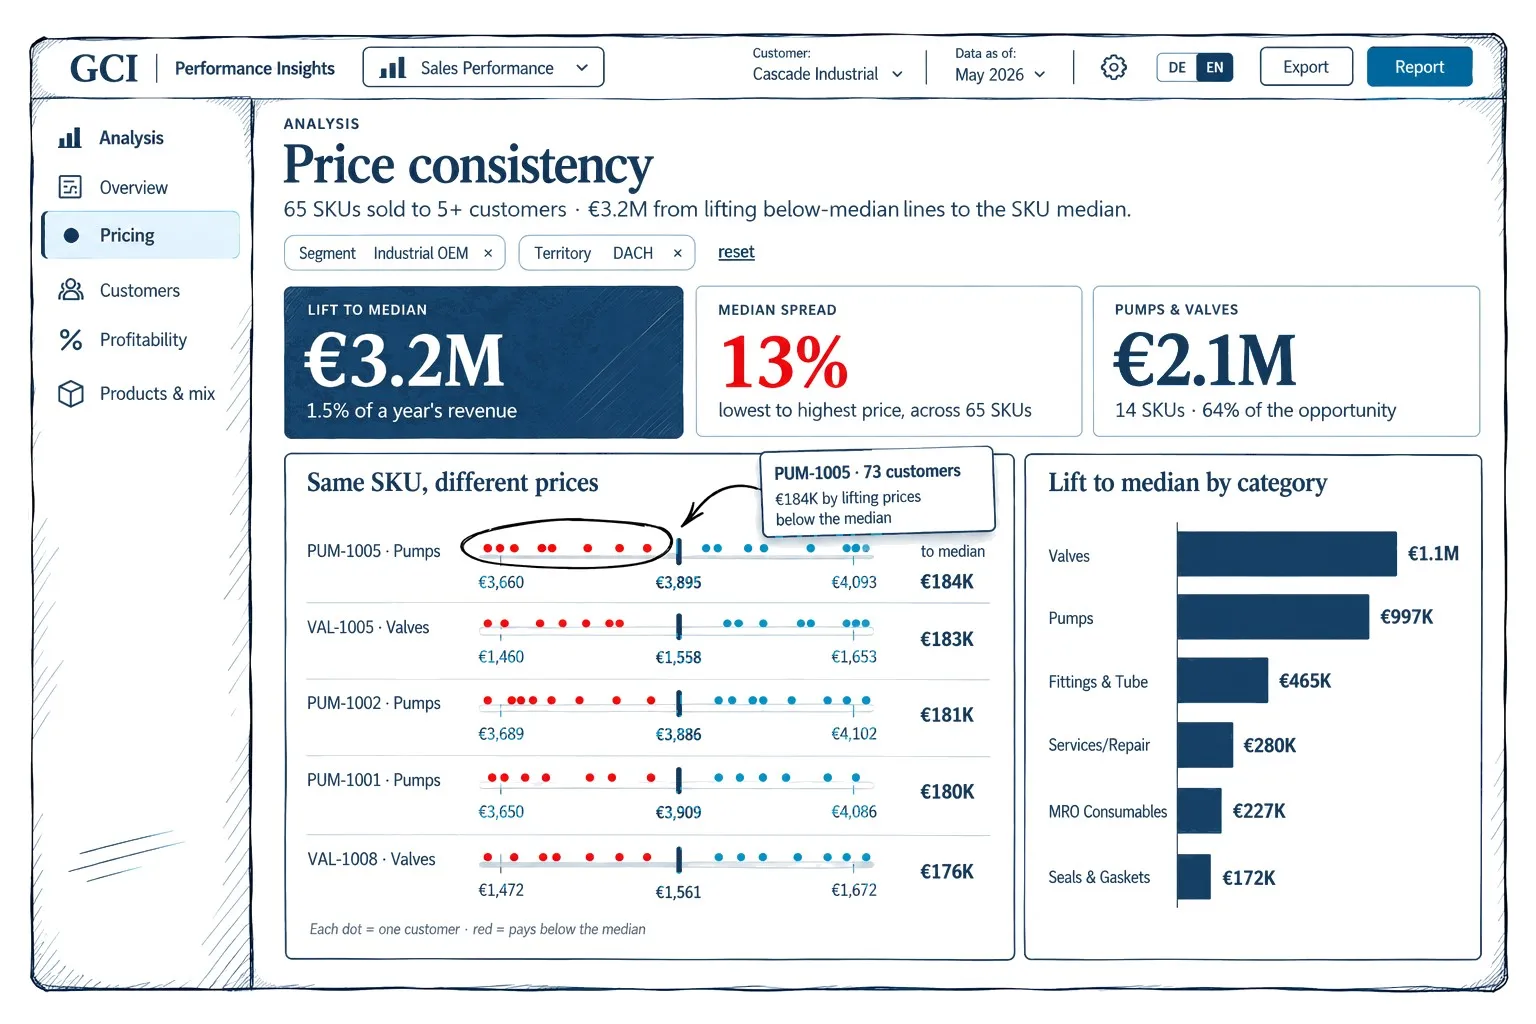
Margin lost through weak price realization becomes visible when you systematically compare realized prices, discounts granted, and terms. The key questions are what prices you achieve for identical products with comparable customers and volumes, and where price differences can't be explained by volume or customer group.

GCI Performance Insights combines discount analysis, product-level price comparisons, and a price waterfall that shows where price is lost on the way from list price to the remaining margin. The first two analyses work with existing order data. The full price waterfall needs additional list price and rebate data. Price differences can be traced back to individual customers and products, and the calculated potential of aligning prices is shown in euros.

This gives you clear starting points for systematic price management, better price realization, and profitable growth.

How do I find cross-selling potential with existing customers?

Cross-selling potential shows up when you compare a customer's basket with those of comparable customers. Basket breadth shows which product categories a customer doesn't buy yet, even though similar customers do. Basket depth reveals additional sales potential within categories the customer already buys.

GCI Performance Insights builds peer groups from your own customers by customer tier and industry, identifies gaps in the product range, and detects product lines a customer has stopped buying. The resulting revenue and contribution margin potential is quantified, so you can set clear priorities for customer development.

Your true share of wallet can't be determined from internal transaction data alone, because the customer's total purchasing volume is unknown. The basket analysis does, however, point to business potential you haven't yet tapped.

How do I detect customer churn early?

In B2B, customer churn often happens gradually: customers order less often, reduce their volumes, or stop buying certain product categories. These early warning signs become visible when you systematically analyze changes in buying behavior. The key is to separate price and volume effects, because price increases can mask declining volumes.

GCI Performance Insights compares buying behavior with the prior year, identifies unusual drops in revenue and volume as well as orders that have stopped coming in, and brings the affected customers together in a risk list. Dormant customers are shown separately. The revenue at risk is quantified, so you can prioritize by financial impact.

This lets sales teams respond early and focus customer retention and win-back efforts on the customers that matter most to your results.

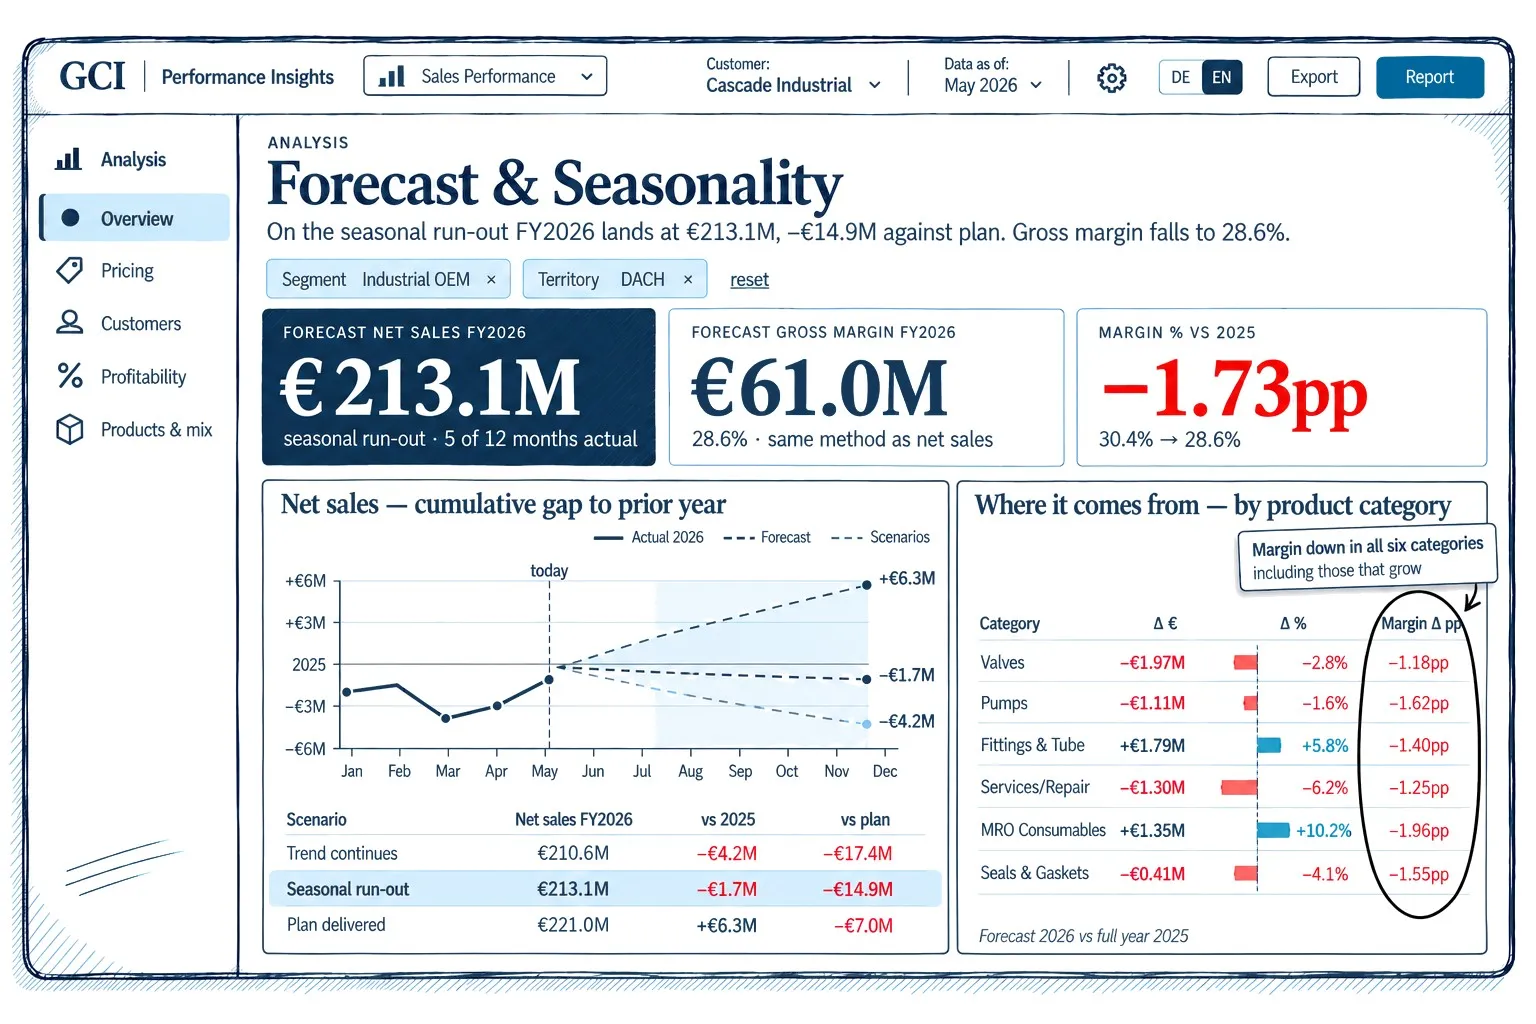
How does GCI Performance Insights help you see what's coming and plan sales actions?

GCI Performance Insights combines early indicators in buying behavior with sales forecasting and puts a value on risks and growth potential. Changes in order frequency and volumes reveal looming churn, and the revenue involved is shown as revenue at risk. A seasonal forecast projects revenue and gross profit in three scenarios and highlights variances against plan.

The results show which customers and areas to address first. GCI then works with your sales team in the scoping workshop and results workshops to develop options and prioritize specific sales actions.

In this way, GCI Performance Insights helps you manage sales with a forward view, protect existing revenue, and put profitable growth strategies into practice.

Who is GCI Performance Insights for, and when is it used?

GCI Performance Insights is designed for executive teams, CSOs, and sales leaders in B2B companies who want to plan profitable growth more deliberately and manage their sales organization by the numbers.

Typical uses include budgeting and customer-level planning, where revenue and contribution margin targets are built from actual customer potential. In regular one-on-ones, it helps managers and reps discuss customer trends, risks, and growth opportunities and set priorities. It is also used in forecast and plan-variance reviews, price management reviews, and to prepare for important customer meetings.

GCI offers a one-time diagnostic or, with Managed Intelligence, an ongoing solution with regular data updates, established management routines, and expert support. The insights can also be made available to sales reps, for example through CRM interfaces or customer and sales briefs.

The analyses used depend on your business model and the management questions at hand.

How does sales potential turn into concrete targets and planned contributions at the customer level?

GCI Performance Insights lets you use calculated sales potential as the basis for revenue and profit planning. Two linked planning approaches are available.

In top-down scenario planning, you can test different assumptions about how much of each lever you'll realize. This shows what contribution would be achievable as a target and how far it would close existing plan gaps.

In bottom-up opportunity planning, sales leaders and reps decide which opportunities they want to realize with individual customers and who owns them. High-potential customers can be planned individually and the remaining potential in aggregate. Cross-cutting initiatives can be included as well.

Comparing the two then shows how far your targets are backed by planned contributions and where planning gaps remain.

What data do you need, and do we have to connect our IT systems?

A one-time export of the relevant business data is all GCI Performance Insights needs. The export covers sales transactions from the last two to three years and, where available, additional price, terms, contract, quote, and planning data. GCI provides a standardized data specification up front, and customer names can be replaced with unique IDs. You don't need to connect your IT systems or build a data warehouse.

The full set of analyses is included. The data you provide determines which of them are possible and how deep they go. They include customer profitability, price realization, customer potential, customer churn, and forecasting.

For ongoing sales management, Managed Intelligence can set up regular data updates and, if needed, interfaces to your existing systems.

Our data isn't clean. Will the analysis still work?

GCI Performance Insights can work with incomplete data, too. Missing or patchy information may limit individual analyses, but it doesn't have to stop the analysis as a whole. The standardized data specification describes which data is required and which data expands what the analysis can do.

In an upfront data check, GCI reviews data quality and determines which analyses can be run reliably. If list prices are missing, for example, certain price comparisons are still possible, while the full price waterfall is limited. Dimensions that can't be scored remain explicitly visible in the Health Monitor.

The analysis also points to weaknesses in the data and possible improvements in the underlying processes and systems. So beyond the business insights, you also get starting points for improving how you manage sales.

How does a diagnostic work, and how much time should we plan for?

A diagnostic with GCI Performance Insights has four steps: a scoping workshop to clarify the questions and data requirements, data handover and data check, running the analyses, and a final results workshop. Results can be available within one week of receiving the complete, validated data export.

The effort on your side is typically two to three person-days for providing data and attending workshops. No system integration or extensive IT project is required.

In the results workshop, GCI works with your executive team and sales leadership to assess opportunities and risks, set priorities, and agree on courses of action. Workshops can take place on site or online. For joint analysis and prioritization, GCI recommends meeting in person.

How is our company and customer data used and protected?

GCI Performance Insights uses the company and customer data you provide solely for the analyses you commission and, where agreed, for later comparisons with your own historical data.

For the one-time diagnostic, you create the data export yourself. GCI doesn't need access to your internal systems. Customer names can be replaced with unique IDs before the data is shared. Confidentiality is governed by contract.

Managed Intelligence runs exclusively in your IT environment. Data reaches it through regular exports, interfaces, or a dedicated data model, and does not leave your company.

Two ways to start.

Want to get to know GCI Performance Insights, or discuss a specific challenge in your sales organization? Choose the starting point that fits.

Get to know GCI Performance Insights

See how GCI Performance Insights turns your transaction data into insights you can act on. In a 30-minute demo, we show you the software, what it can analyze, and typical use cases. If it's a fit, we define the scope of your diagnostic and give you a fixed price up front.

Book a demo

Discuss your challenge with us

Working on questions around sales performance, customer profitability, or financial management? Let's talk through your situation and possible approaches, and find out together where a deeper analysis makes sense.

Talk to an expert